BRAVO Node 10
Deployment Location:
Thornbury Fishway exit, Beaver River, Ontario
Current Conditions: Online March 2025. Fishway opened April 1
System Type: BRAVO G3IP self-cleaning digital daytime colour / night IR fishway monitoring and artificial intelligence based fish counting (BRAIN)
Significant Observations:
Water Temperature at Node (C): 7.06
Node 10 LIVE Underwater Video
Video Player
00:00
00:00
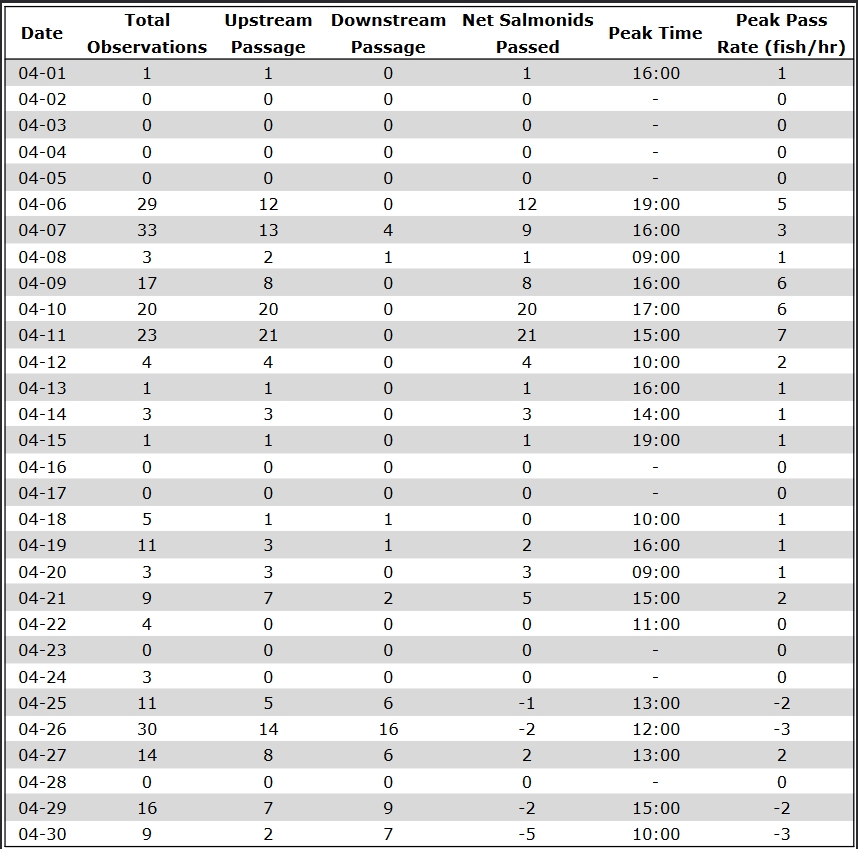
Current Daily Fish Passage Count
| Date | Total Observations | Right/ Upstream Passage | Left/ Downstream Passage | Net Salmonids Passed | Peak Time | Peak Pass Rate (fish/hr) | Water Temp (C) |
| 04-01 | 1 | 0 | 0 | 0 | 18:00 | 0 | 2.9 |
| 04-02 | 1 | 0 | 0 | 0 | 02:00 | 0 | 3.4 |
| 04-03 | 7 | 0 | 0 | 0 | 02:00 | 0 | 2.8 |
| 04-04 | 1 | 0 | 0 | 0 | 02:00 | 0 | 4.5 |
| 04-05 | 0 | 0 | 0 | 0 | - | 0 | 6.1 |
| 04-06 | 4 | 2 | 0 | 2 | 20:00 | 2 | 6.1 |
| 04-07 | 0 | 0 | 0 | 0 | - | 0 | 4.8 |
| 04-08 | 0 | 0 | 0 | 0 | - | 0 | 2.6 |
| 04-09 | 1 | 0 | 0 | 0 | 03:00 | 0 | 1.6 |
| 04-10 | 0 | 0 | 0 | 0 | - | 0 | 2.1 |
| 04-11 | 0 | 0 | 0 | 0 | - | 0 | 3.1 |
| 04-12 | 142 | 0 | 3 | -3 | 14:00 | -3 | 3.1 |
| 04-13 | 0 | 0 | 0 | 0 | - | 0 | - |
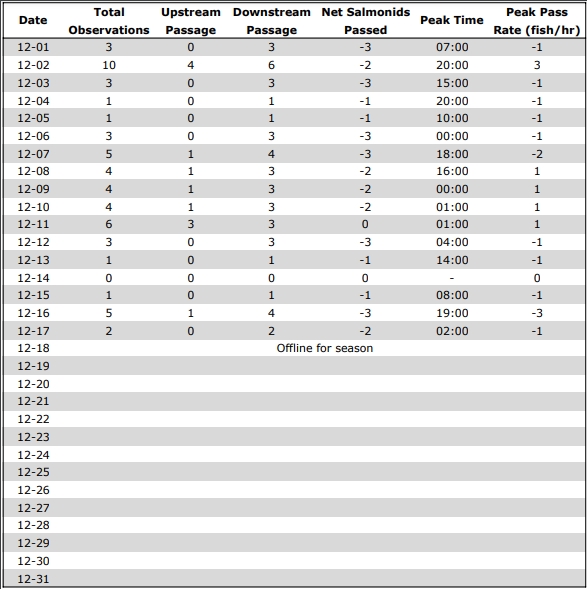
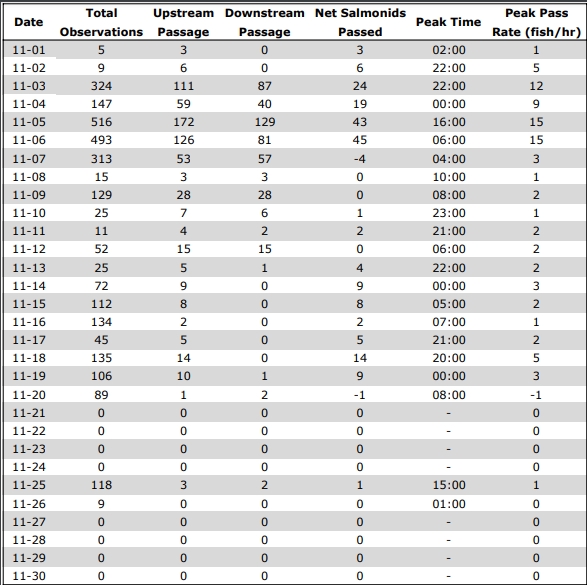
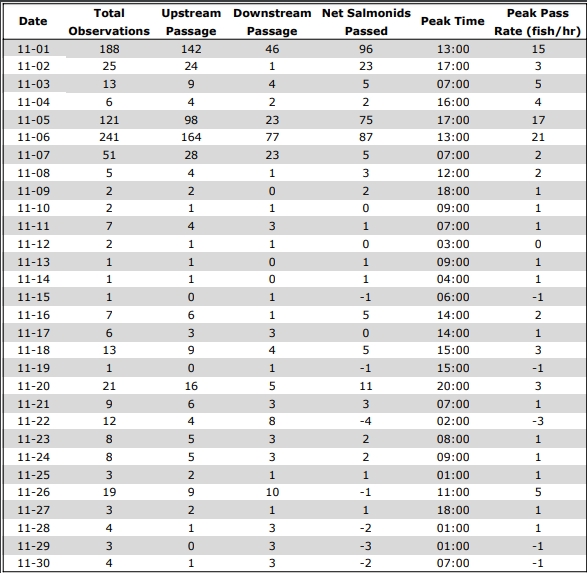
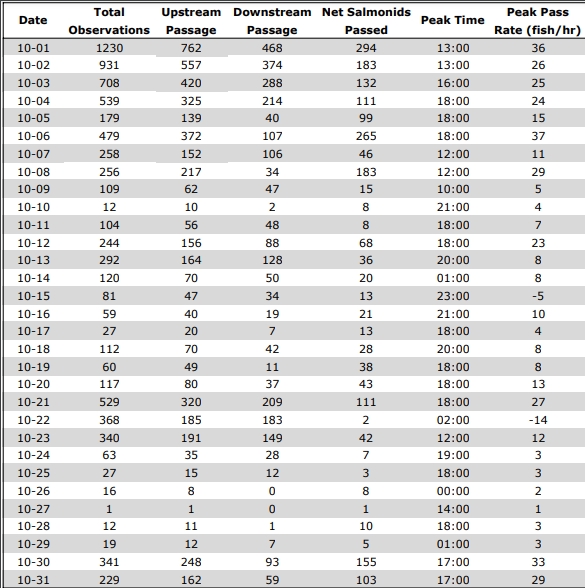
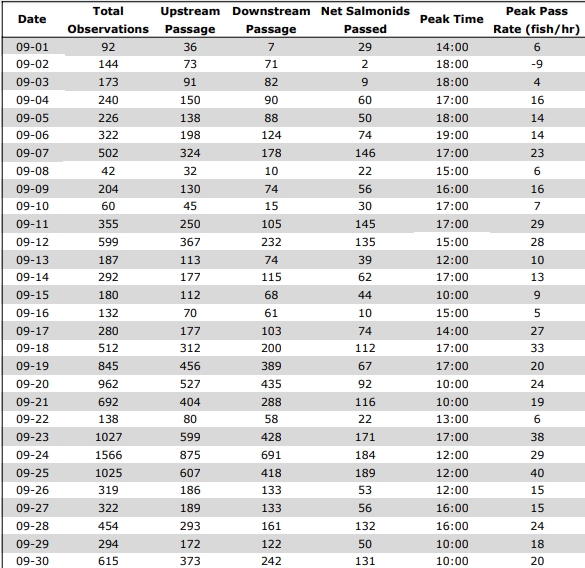
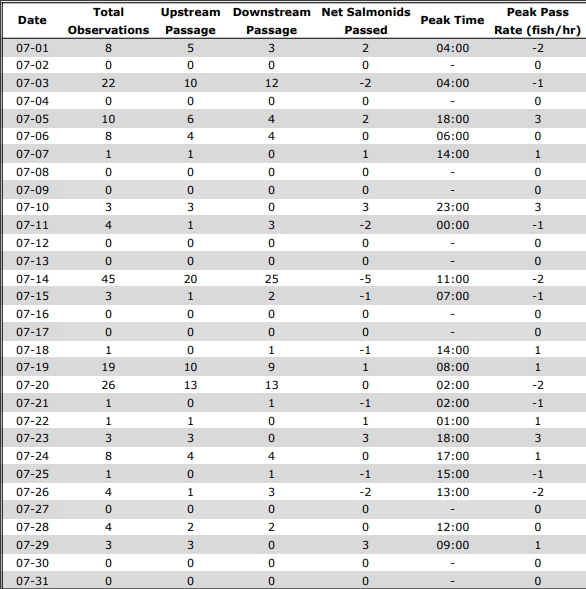
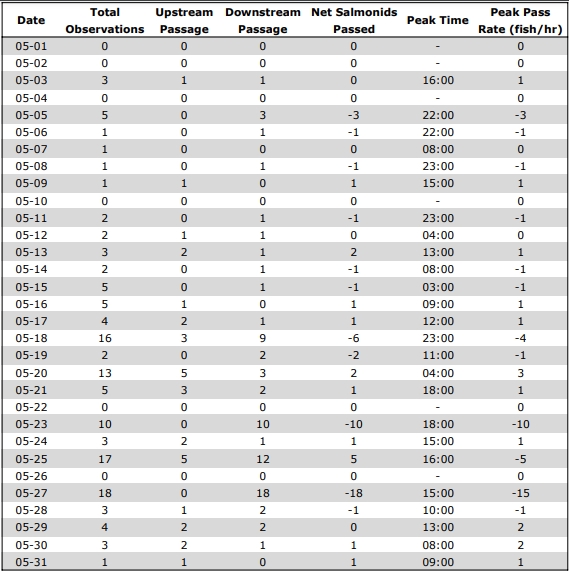
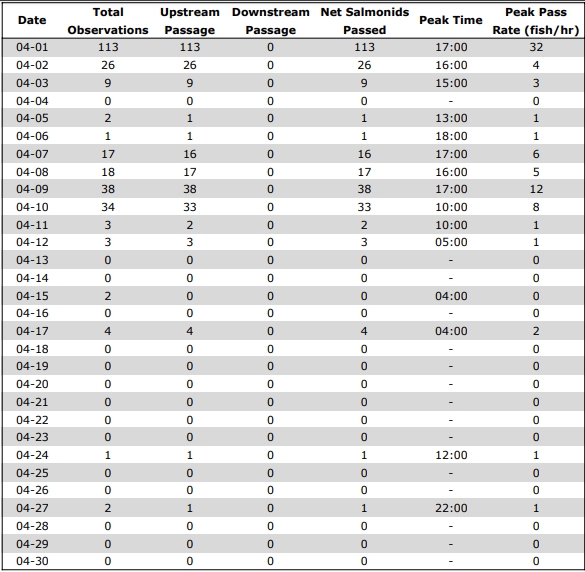
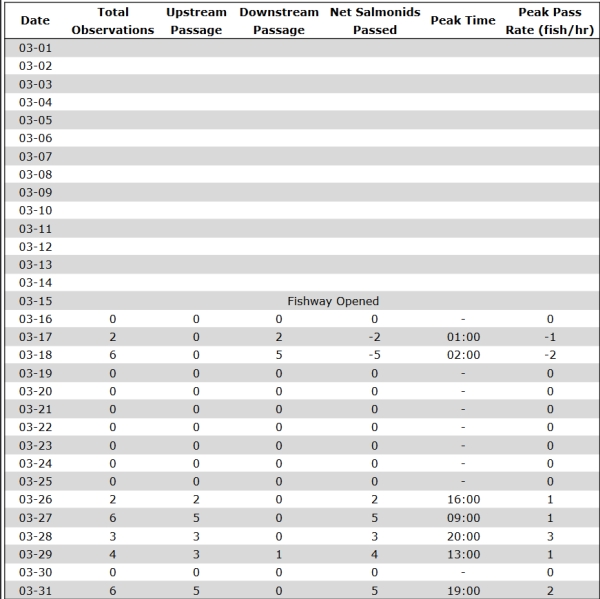
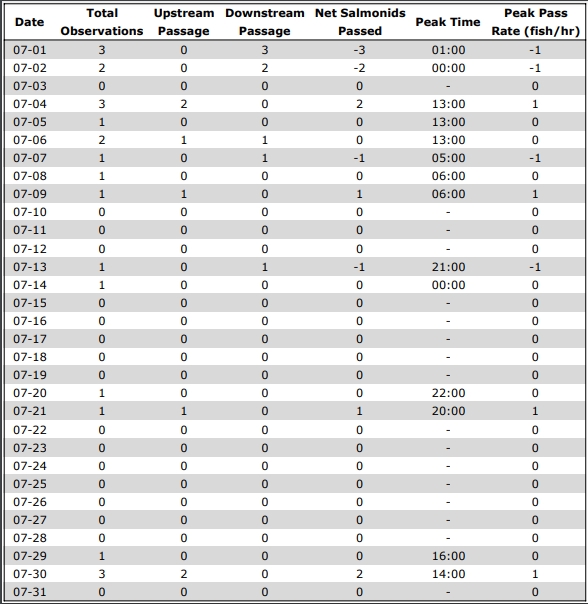
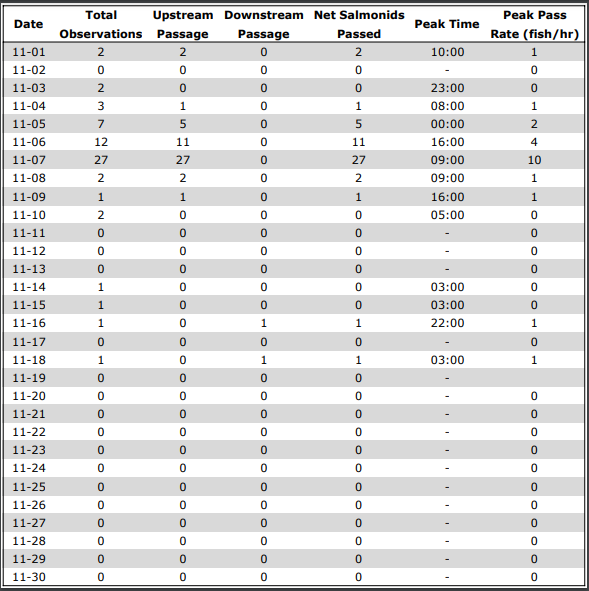
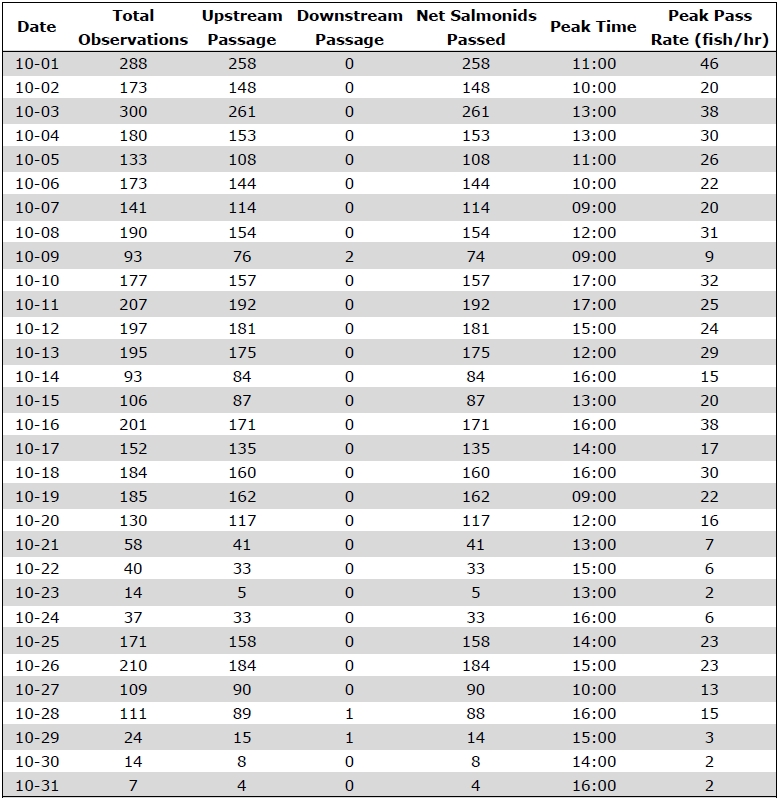
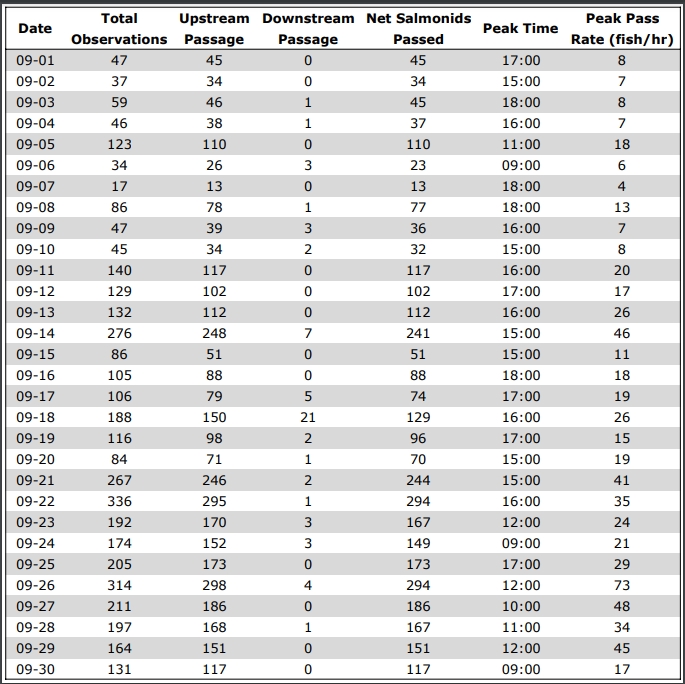
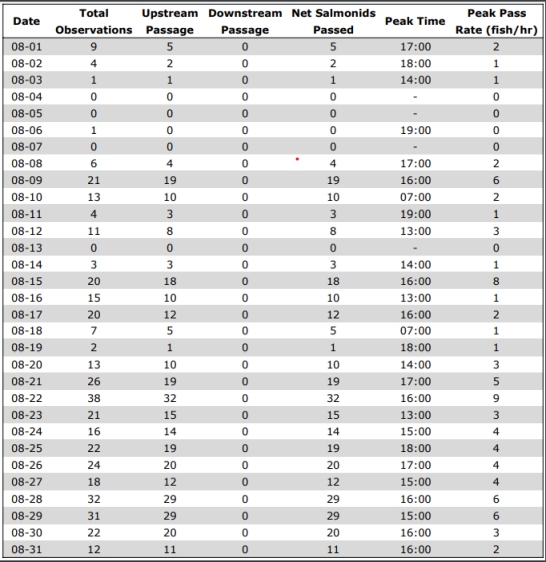
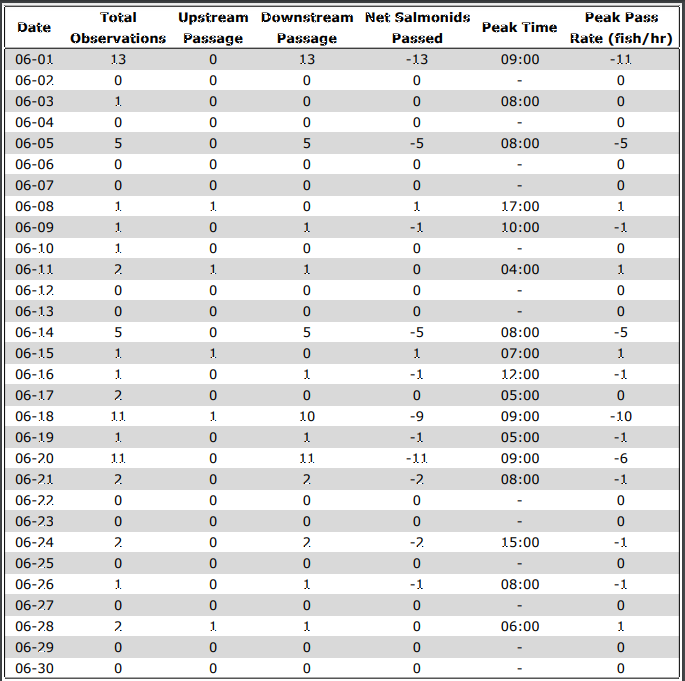
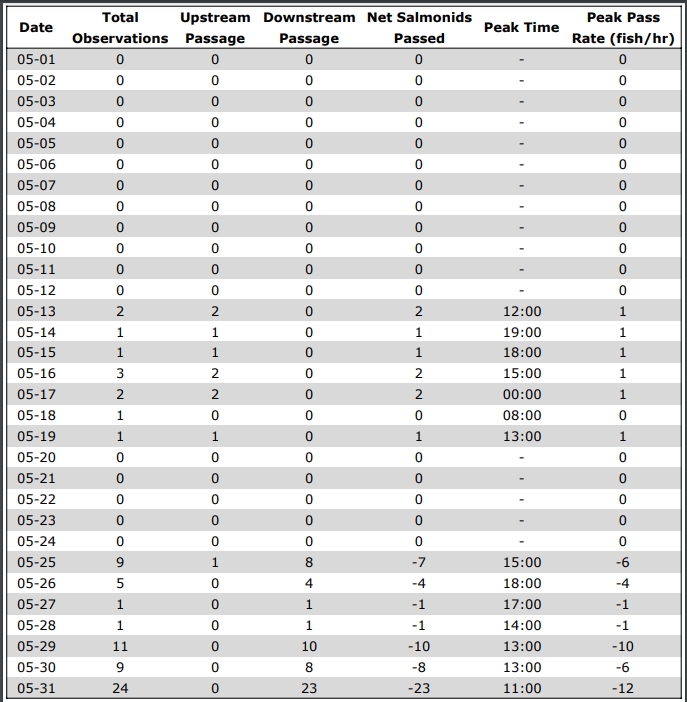
Total Observations: total number of potential fish observed
Net Salmonids Passed: upstream passage - downstream passage. Positive indicates net upstream movement, negative indicates net downstream movement.
Peak Time: hour of greatest net movement
Peak Pass Rate: the net number of fish passed during the hour
Water Temperature: taken at 9am
Previous Fish Passage Data & Counts
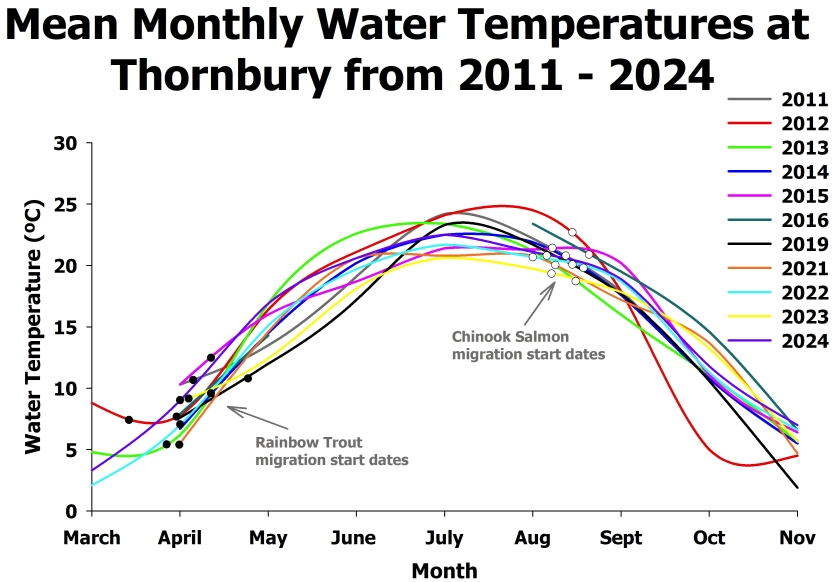
Temperature History
Fish Passage Examples